Processing and homogenization of large climatological datasets
For the purpose of data quality control, homogenization and analysis of climatological time series (originally air temperature and precipitation measurements of the Czech Republic within the period of instrumental measurements), software package was created which is capable to process all the needed computations for the whole dataset automatically and very smartly. Users has full control over each step of the processing. The software package consists of these software: LoadData for getting data from central database (e.g. Oracle), database software ProClimDB and software for statistical testing AnClim. By means of this software package it is very easy to get results of homogeneity testing, time series or even spatial analysis, to adjust and process series as you want. The only thing, which is not (and can not be) fully automated, is decision about outliers and inhomogeneities adjustment, this part will stay subjective every time. Anyway, the software helps a lot in decision-making by means of a big variety of outputs.
By means of LoadData software – application for loading data from central database, it is very easy to download all needed data, create cross tables, export data to other formats (e.g. TXT for AnClim).
ProClimDB software processes and prepares dataset for homogeneity testing and further analysis. In the first stage it helps with data quality control – e.g. finding outliers, comparing values of tested stations to its neighbours and selecting suspicious cases, etc. As for homogeneity testing, it is capable to create various types of reference series for each candidate series. The reference series can be calculated as: 1. average from the best correlated stations, 2. average from the nearest stations, 3. regional average from all stations available (together with converting all the series into anomalies).
AnClim software then (using automation functions) quickly gets results from selected tests of homogeneity (SNHT – several variants, Easterling and Peterson, Vincent method and others, within couple of weeks a method of Olivier Mestre will be included as well).
After getting a big amount of homogeneity testing results for each candidate (by means of combining different reference series, using several tests of homogeneity, using monthly, seasonal and annual averages, etc.) – all the results (we can call it an ensembles system) are processed in ProClimDB again and a lot of outputs is created, e.g. probability of a given year of inhomogeneity (number of detections to number of all theoretically possible detections), distribution of inhomogeneity detections in individual months and others. Then follows the most tedious work of the data homogenization part: according to metadata (if available), probability of detected inhomogeneties and other info such as graphs of differences etc., it is needed to decide which inhomogeneties are to be adjusted. Adjusting series for selected inhomogeneties, in ProClimDB, gives a lot of characteristics serving for assessing whether the corrections were right (t-test, increase of correlations, etc.). After the adjustments, filling of missing values can be run.
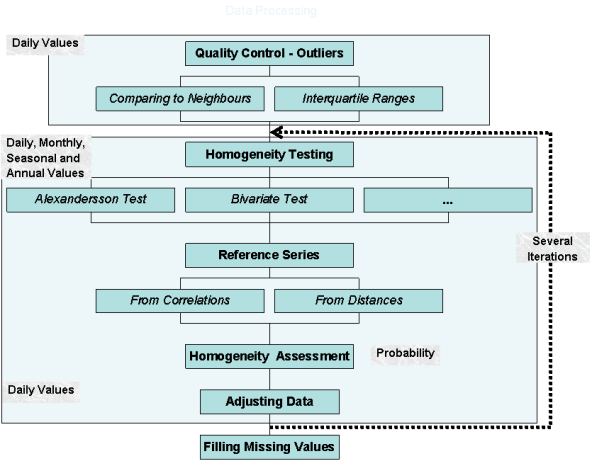
Scheme of usual data processing during data quality control and homogenization (preparing data for time series analysis)
Various methods of time series analysis can be performed during subsequent data processing after homogenization (in ProClimDB or AnClim software): e.g. correlation analysis, analysis of cyclicity, extreme values analysis, filtering series and others. Tools for model outputs verification (comparison with station data) can be also found in the software package.
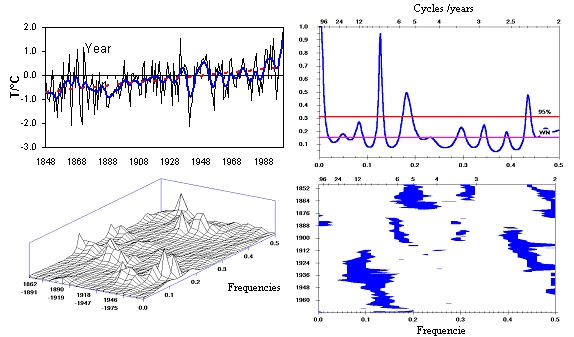
Example of analysis in AnClim
Remarks to the software package:
- This software package is designed for homogenization of whole regions (countries, examples can be found e.g. here), the more stations are included in the processed database, the better (superior construction of reference series etc.). There is no limit (e.g. number of stations) for the processing. We commonly process hundreds of stations.
- What is one of the advantages of this way of processing data (beside full automatization) is that you are also given probabilities of inhomogeneities (for years, parts of the series, or the series as a whole) – so you are able, on the first sight, to compare e.g. which stations are more reliable and with good quality of data and which series are pure.
- Versions of the software exist for processing monthly as well as daily data. But generally, it is possible to process any time step (including minute rainfall data for example).
- There is no problem to include other statistical tests into AnClim (we only need to have the algorithm), the same is valid for ProClimDB – we can add ANY functionality for processing the database which you will desire. This is one of the way how the software is improved – according to users’ needs.
You can run the software by yourself or with help of us.